Download the PDF
Since the beginning of the 2000s, and in particular following the food crisis of 2007/08, agricultural and food policies have been reinforced worldwide, with the notable exception of the European Union, which continues, alone, on the path of decoupling. helpers. We propose here a series of graphs and associated datasets that allow, based on the main indicators developed by the OECD, to evaluate agricultural and food policies in the 23 countries monitored. Special attention is being paid to seven of the main agricultural producers, namely Australia, Brazil, Canada, China, the United States, Russia and the European Union. Given its agricultural and demographic importance, India would have deserved to be included in the list, but the OECD has not been following the agricultural and food policies of this country for too short a time so that the data collected will be considered reliable on the continent. the whole period. Beyond the amounts of support to producers and consumers, market support and the different types of direct support are distinguished to draw a typology of agricultural policies.
1. Evolution of total support of seven of the major agricultural producers
Total Support Estimate (TSE) collects all direct and indirect support for agriculture and food. It is broken down into two sub-indicators: Producer Support Estimate (PSE) and Consumer Support Estimate (ESC). Money subsidies are counted, but so are the measures taken to keep prices above international prices, which are generally very low – dumped prices – because they come close to the costs of production on the pioneer fronts of the producers. more competitive export, but whose production remains insufficient to meet all demand. The evaluation of these measures according to this logic is therefore questionable and we have already underlined it: rather than taking as a reference the observed international price, a real evaluation of the supports should be established starting from an estimation of the “normal” price. that is to say, the price corresponding to the production costs of the least competitive producers but nevertheless necessary to meet all needs. But in order not to bias the comparisons resulting from these indicators, we have not adjusted them at this stage.
On the other hand, we have made indispensable adjustments, such as the reinstatement of a significant share of food aid in the US, which has been overshadowed by the OECD. In fact, only $ 34 billion is matched in the US ESC, while the budgetary cost of programs (Supplemental Nutrition Assistance Program, Scholl Breakfast Program, National Special Program Milk Program, Child / Adult Care Food Program, WIC etc.) amount to $ 101 billion a year (USDA source) over the 2014-2018 period.

Figure 1: Evolution of Total Support Estimate (TSE) for Major Producing Countries
Figure 1 shows the evolution since 2000 of the TSE for the 7 main agricultural powers: Australia, Brazil, Canada, China, the United States, Russia and the European Union.
The United States (+ 80%), China (+ 853%) and Russia (+ 225%) experienced a significant increase in TSE over the period. This development was particularly noticeable between 2007 and 2012 under the double effect of the food crisis and the financial crisis that led these countries to strengthen their support for the development of agriculture and measures that favor the poorest populations.
Beyond the absolute value of the EUT, it is useful to report this indicator of other quantities to account for differences in population, wealth or production.
Total support per capita
Figure 2 shows the TSE in relation to the number of inhabitants of the country concerned.
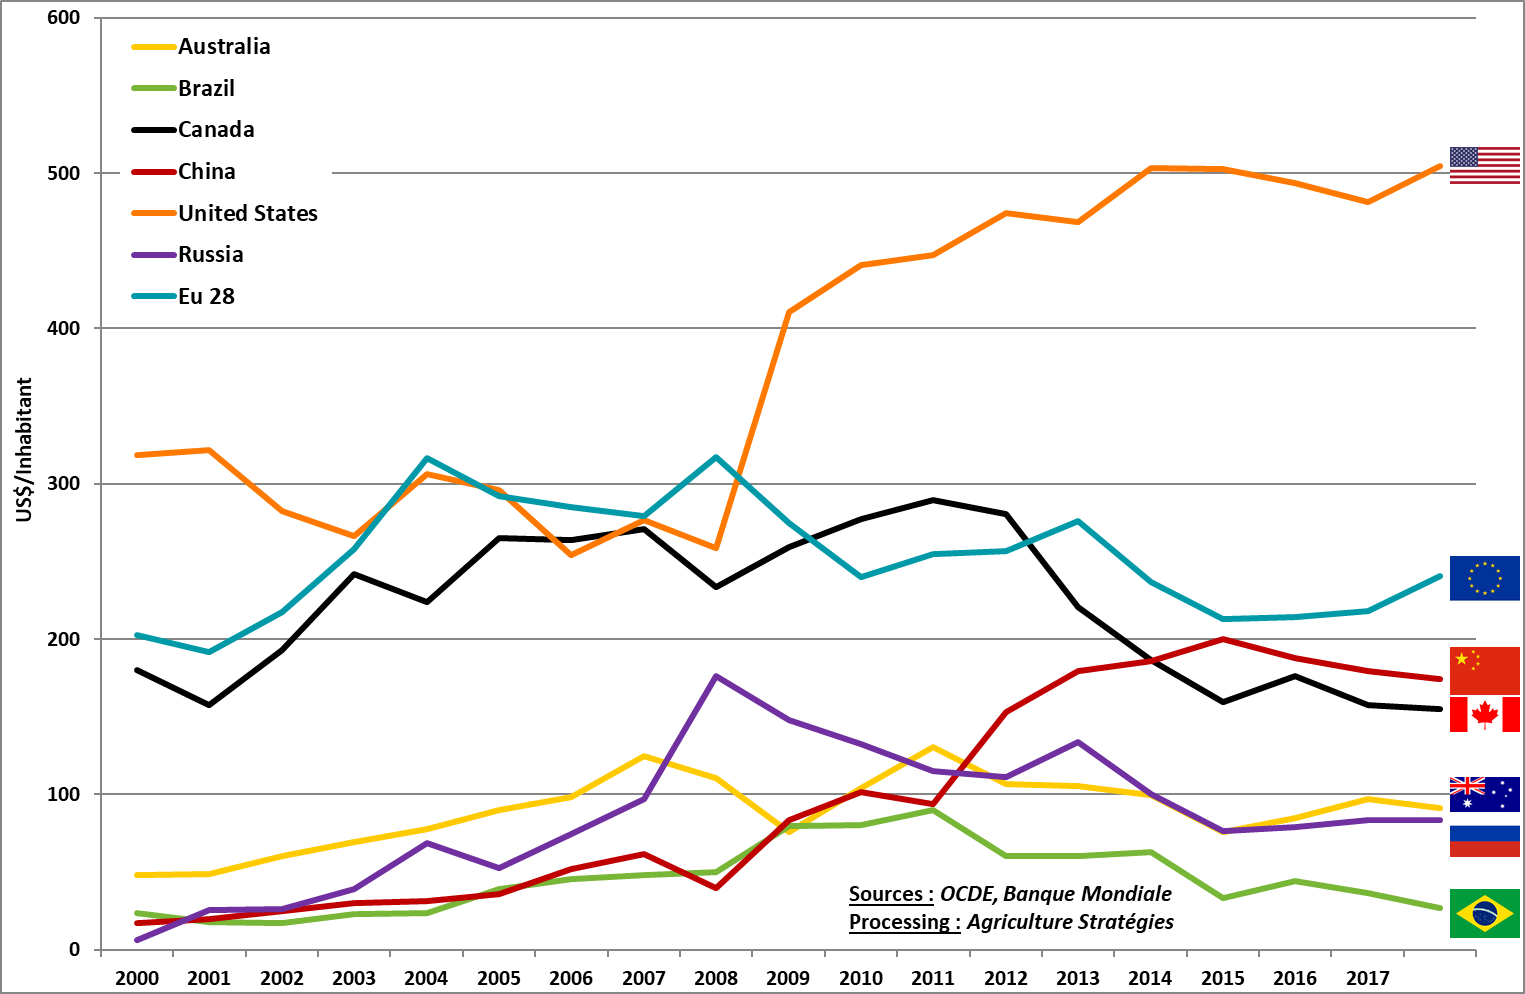 Figure 2: Evolution of TSE per capita for the main producing countries
With its 1.4 billion inhabitants, China is the most populous country. While the increase in the ratio of EST per capita remains apparent, China occupies only the third place at the end of the period with a TSE of $ 175 per inhabitant, a level close to the European Union ($ 240) and Canada ($ 155). ), a country with a much higher standard of living. With nearly $ 500 per capita, the United States is largely ahead.
Total support as a percentage of GDP
Figure 3 reports total support for country wealth as measured by gross domestic product (GDP).
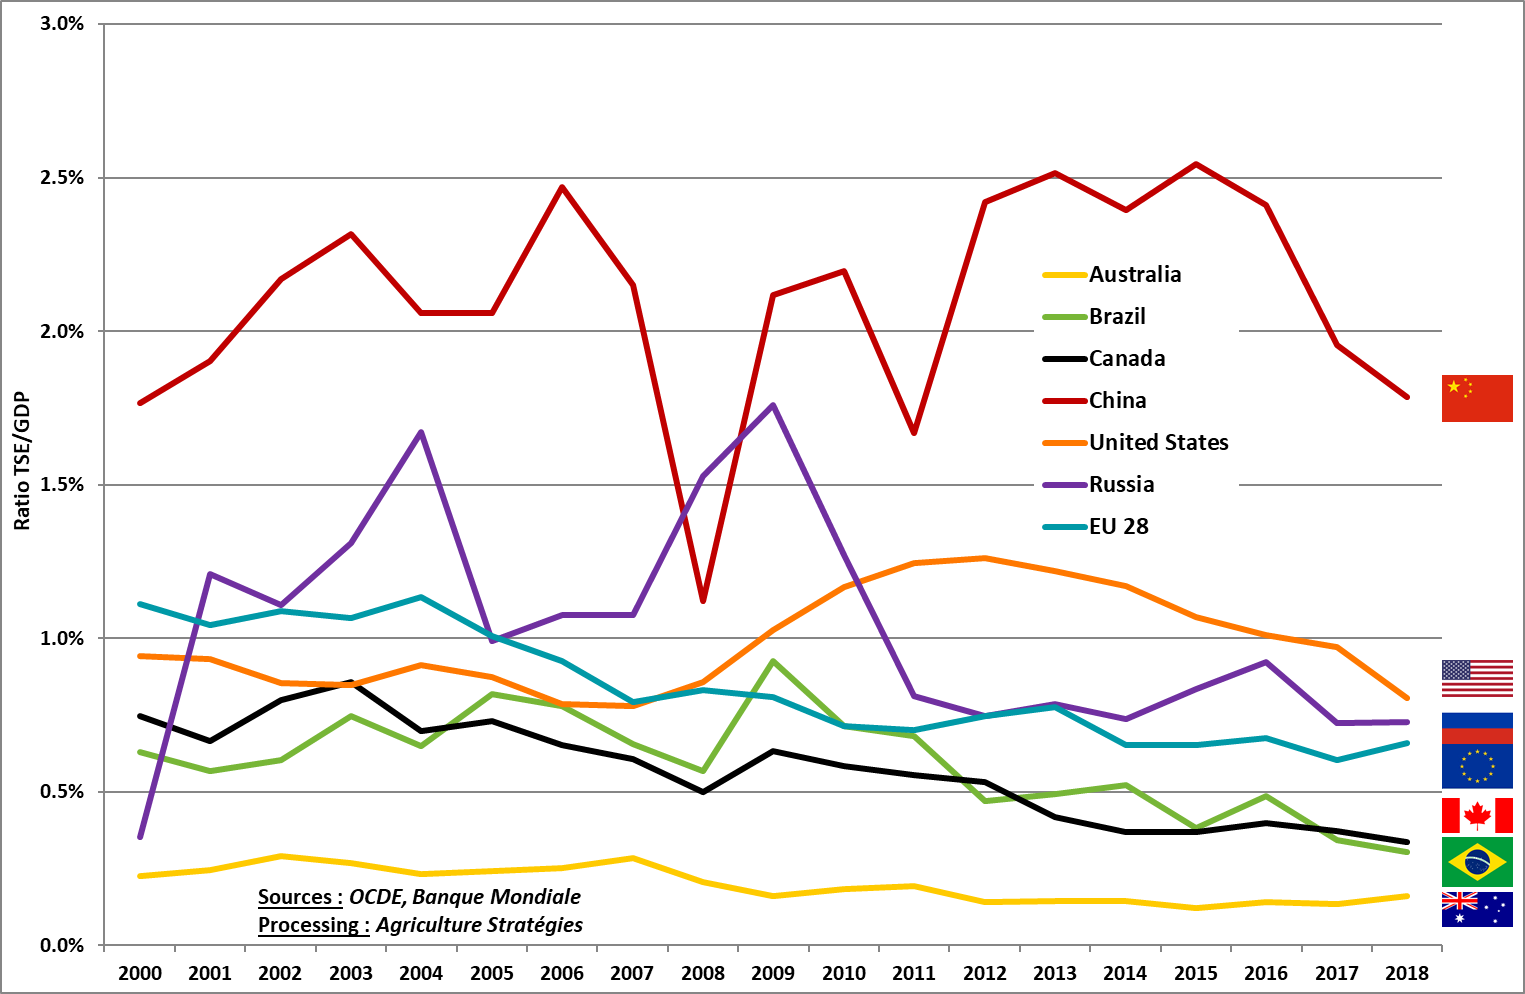 Figure 3: Change in the ratio of agricultural support to GDP for the main producing countries
In terms of GDP, China is the country that spends the most support with the equivalent of 1.8% of its GDP. The decrease in 2008 corresponds to the rise in international prices: with China mainly supporting the protection of its domestic market, the gap between domestic and international prices has decreased significantly, thus lowering its TSE. Except for the fall of 2008, the ratio EST / GDP is relatively stable over the whole period even though China has experienced very significant growth. The Chinese development strategy has not gone through the sacrifice of its agriculture, a classic pattern of industrial development policies. On the contrary, the strengthening of China’s TSE is due to a concern to maintain a high level of food security while balancing the relationship between cities and the countryside and stimulating demand in the latter.
The EU, which was in second place with around 1.1% in 2000, is now fourth with only the equivalent of 0.6% of GDP, overtaken by the United States and Russia. Brazil and Canada, with very different economies and levels of development, also experienced erosion of the same order of magnitude over the period to reach a TSE of 0.4% of GDP.
2. Evolution of the ESP
To get further into the analysis of the evolution of support, we are interested here in the estimation of producer support (PSE) that is related to the value of agricultural production (the turnover of the Agriculture).
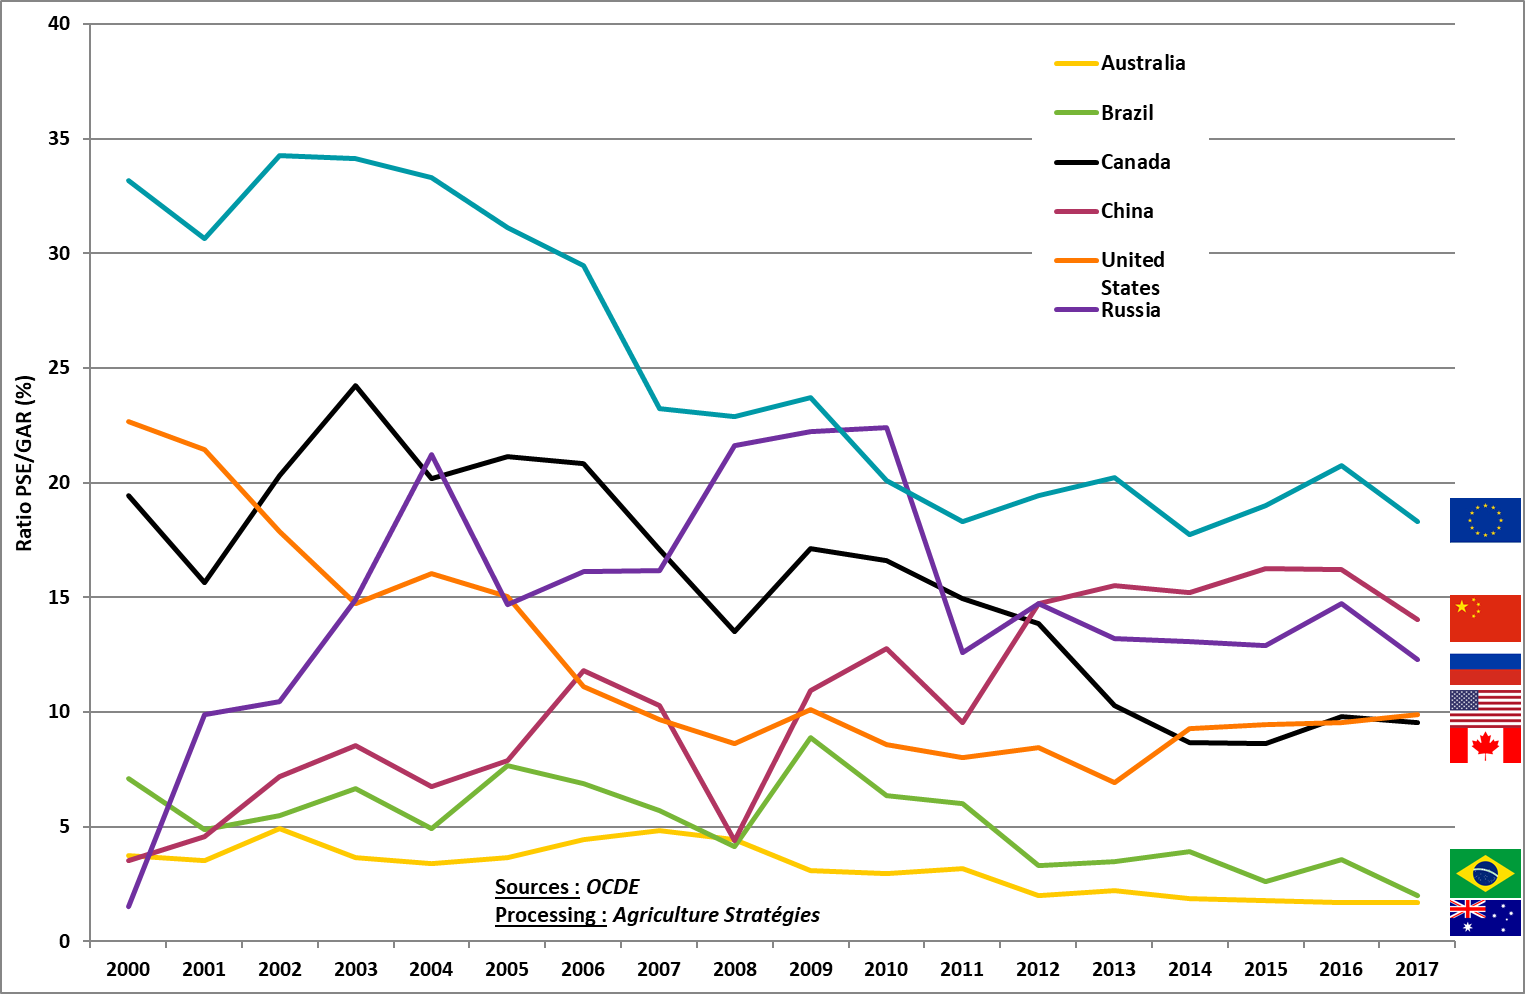 Figure 4: Ratio between PSE and total value of agricultural production for the main producing countries
By comparing the PSE with the value of production, there is a convergence between developed countries (EU, US and Canada) where the ratio decreases, and emerging countries (Russia and China) where the ratio increases. These countries are in the range of 9.6% for Canada to 18.3% for the European Union. Australia and Brazil, however, remain away from this convergence with a producer support equivalent of between 3% and 4% of the total value of agricultural products.
3. Level and types of support for the 23 countries monitored by the OECD
Beyond the top seven agricultural countries, the OECD is also the agricultural and food policies of other, less important countries in terms of production. The table below shows the PSE of each country and its components in relation to the value of production (RAB means Gross Agricultural Recipe) for the year 2017. The PSE is in fact broken down into 5 categories: output “corresponds to market support and thus to tariff protection,” input use payments “are direct aid for the purchase of inputs,” payments for current production ” are aid coupled with production volumes, “payments for non-current production” are decoupled and counter-cyclical direct aids established on a historical production reference, and finally the fifth category includes the other aids.
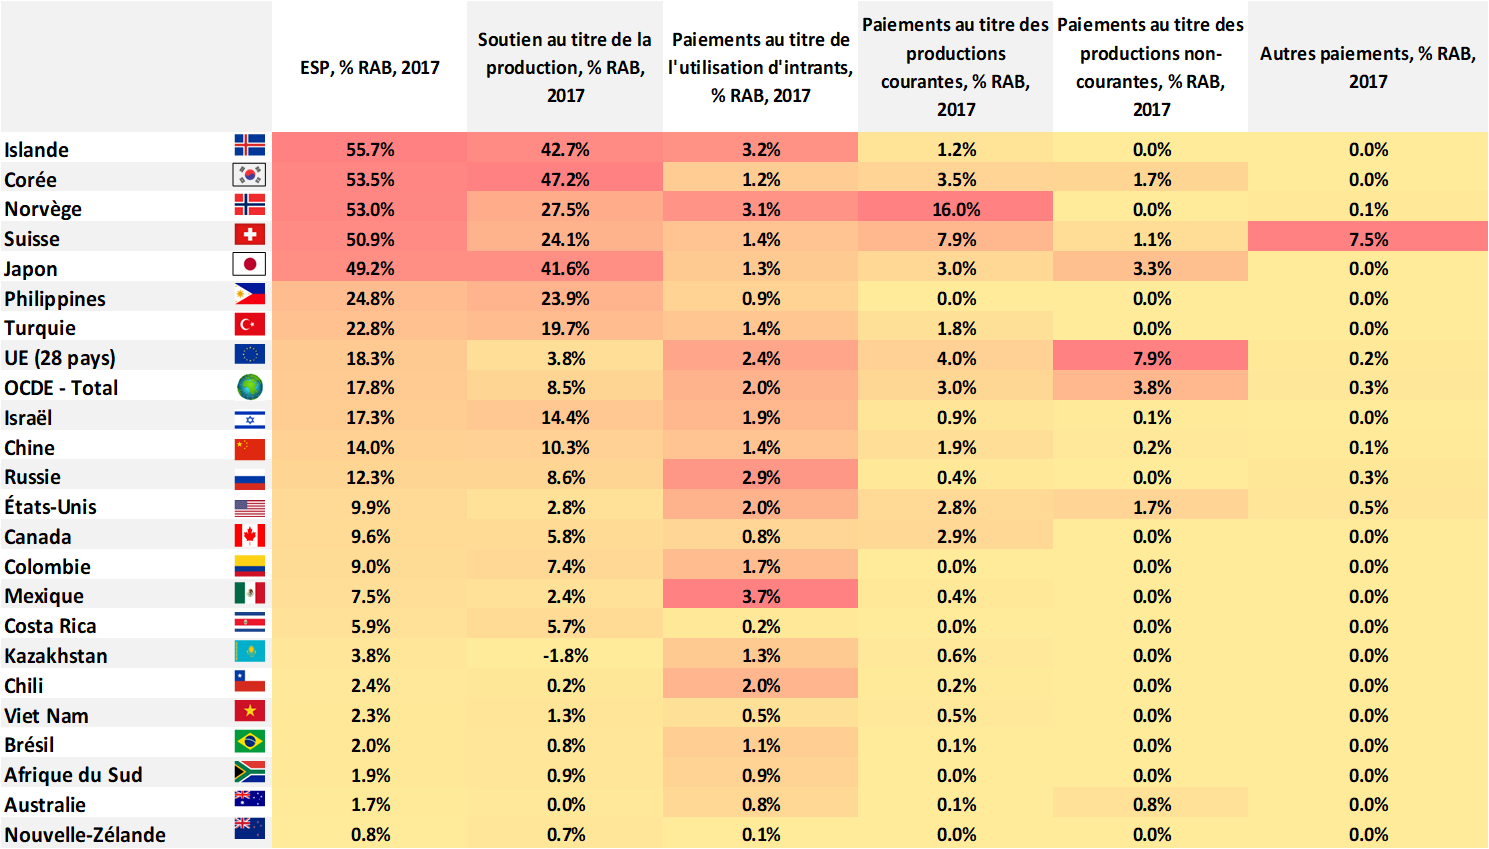 Figure 5: PSE and components of PSE relative to the value of agricultural products (OECD source)
Figure 6 shows the great disparity in the level of PSE and its components relative to the value of agricultural products. For Japan, Switzerland, Norway, Korea and Iceland, producer support accounts for almost half of the value of the products. The Philippines and Turkey with 25% and 23% are above the EU (18%).
At the other end, the value of the PSE for Ukraine is negative because of the fact that Ukrainian agricultural prices are lower than international prices, the difference being explained notably by the transport costs for exporting. New Zealand, Vietnam, Chile and Kazakhstan have a profile similar to Brazil and Australia previously seen.
To go further, we are interested in the components of ESP. In the first place, it seems appropriate to isolate the support for production, which, it should be remembered, is not subsidies paid directly to producers, but support through customs duties which allow domestic prices to be above international prices. In Figure 7, we situate the countries according to two dimensions: in abscissa, the intensity of the ESP revealed via the ratio ESP / Gross agricultural receipts, and on the y-axis, the share of the market supports in the whole of ESP.
 Figure 6: Typology based on the ratio ESP / Gross Farm Receipts and the share of market support in ESP
The distinction made makes it possible to establish a typology where countries are divided into five groups:
- Group 1 (Korea, Japan, Iceland, Norway, Switzerland) is characterized by a very high ESP / RAB and a predominantly market-based ESP, although direct subsidies are also important in the countries located in this group located on the European continent ;
- Group 2 (Australia, Brazil, Chile, New Zealand, South Africa, Viet Nam) groups countries with very low ESP / RAB;
- Group 3 (Israel, the Philippines and Turkey) has a fairly large ESP / RAB between 18 and 25% and ESP is more than 80% of the market support;
- Group 4 (Canada, China, Colombia, Costa Rica, Russia) is getting closer to Group 3 with mainly market support but with a lower support intensity, the ESP / RAB ratio between 6 and 14%;
- Group 5 (United States, Mexico, European Union) is distinguished by the low share of market support in ESP and an ESP / RAB ratio between 7.5% and 18.3%.
Although they share a small share of market support in the PSE, Group 5 is the most heterogeneous in that Mexico mainly mobilizes input subsidies, while the EU and the Member States United States uses the different categories and in particular that relating to “payments for non-current productions”. The latter includes counter-cyclical aid in the United States and decoupled aid for the European Union. These two types of aid have in common not to be based on actual production, but the former depend on the price level while the latter are paid regardless of any economic dimension.
4. What to remember from this overview?
- Total support for agriculture and food varies widely between countries. However, we do not find the distinction between rich and poor countries: developed countries like Australia or New Zealand have a low level of support while emerging countries like China and Turkey are characterized by relatively consistent. These are especially in the “new” countries, of recent stands, where one observes the weakest supports.
- Among the major producing countries there is some convergence in the level of agricultural support over a range of 15 to 20% of the value produced: where support was higher as in the EU, it decreased; where he was weak, he increases. There is also a strengthening of support for agriculture and food as a response to the 2007/08 food crisis.
- Finally, market support through tariffs to protect against international dumped prices remains the most used form of support in countries where support is significant. The three exceptions are Mexico with input subsidies, the United States with coupled and countercyclical aid, and the EU with mainly decoupled aids. Remember that the European Union is the only group to base its agricultural policy on decoupled aid.