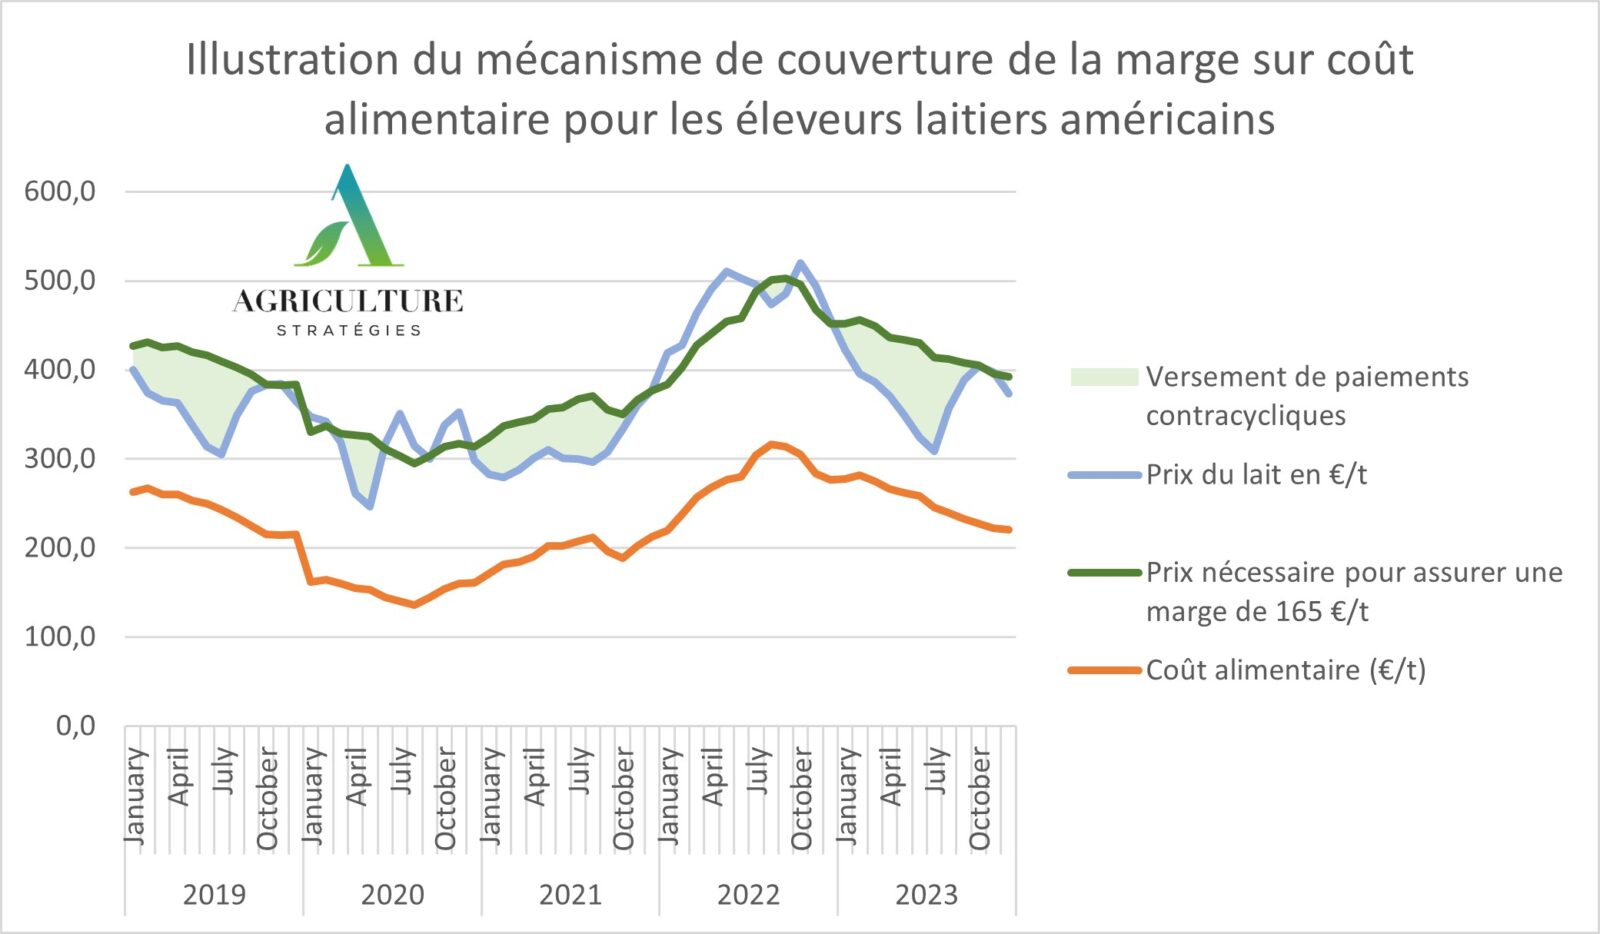
Ces prévisions, réalisées sur la base de la politique actuellement en cours, apportent en effet des éléments intéressants. Alors que les producteurs, notamment de maïs et de soja, avaient majoritairement misé sur le programme d’aides contracycliques sur moyenne mobile (Programme ARC – Agricultural Risk Coverage), les subventions octroyées dans ce cadre devraient diminuer en 2018, pour la première fois, se situer au niveau des soutiens délivrés via le second programme contracyclique sur grandes cultures, qui se déclenche à partir d’un prix de référence fixe (Programme PLC – Price Loss Coverage). Cela signifie qu’en période de prix déprimés, le niveau de la moyenne mobile s’affaisse, limitant d’autant la couverture contre des prix bas pour les agriculteurs,incités de ce fait à se rattacher à des prix de référence fixes.
Les services du Congrès américain anticipent donc que les agriculteurs vont massivement choisir le programme PLC pour la prochaine période : pour le maïs le programme concernerait 84,6% des surfaces bénéficieraient du PLC à partir de 2019. Par ailleurs, ces prévisions n’intègrent pas l’issue potentielle des négociations sur le prochain Farm Bill qui pourraient se traduire par une augmentation des prix de référence du programme PLC.
A l’heure où les ressources budgétaires de la PAC tendent à diminuer, les Européens devraient plus que jamais s’inspirer du Farm Bill américain et de ses aides contracycliques.
Christopher Gaudoin, Chargé de veille et d’analyse stratégique
On April 9, 2018, the Congressional Budget Office (CBO) released its updated and revised baseline for the major programs in the farm bill (Farm Programs April 2018 Baseline; SNAP April 2018 Baseline). If Congress reauthorizes the farm bill programs this year, the April baseline estimates of spending (outlays) will control the funds available to complete the effort. This article reviews the updated baseline for the major mandatory programs in Title I (commodities), Title II (conservation), Title IV (nutrition) and Title XI (crop insurance) and CBO reported outlays back to 2008 (CBO, Details About Baseline Projections for Selected Programs).
Background
Each year, the Congressional Budget Office (CBO) forecasts spending for mandatory Federal programs for the next ten years. Known as the CBO Baseline, these spending estimates are used during farm bill negotiations. In general, when Congressional committees work to reauthorize mandatory programs and policies in the farm bill they must not add spending to the baseline. In that way, the CBO baseline provides the upper limit on spending on agricultural spending. For farm bill negotiations during this year, baseline spending of concern is for the 2019 through 2028 fiscal years.
The CBO April 2018 Baseline projects average spending at $86.72 billion per fiscal year, or $867.2 billion for the ten-year budget window. Of this, 99.5% of the projected spending is from four titles in the farm bill: Title I, Commodities; Title II, Conservation; Title IV, Nutrition; and Title XI, Crop Insurance. Roughly 77% of the baseline spending is for the Supplemental Nutrition Assistance Program (SNAP) in Title IV; both Title I and Title II programs account for 7% of spending each. Spending on Crop Insurance makes up roughly 9% of total spending. The baselines for each of these four titles is discussed in further detail.
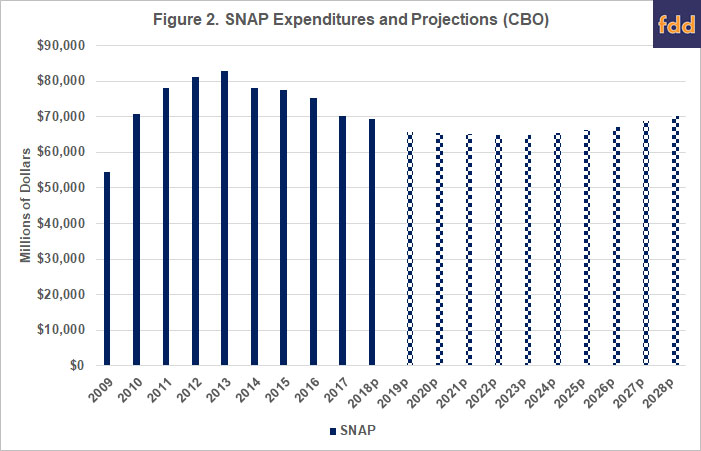
For background and a longer term perspective, Figures 1 and 2 place the 2018 Baseline (FY 2019-2028) into a longer timeframe of spending as reported by CBO from Fiscal Year 2009 through 2018; 10 years of reported expenditures compared to 10 years of projected expenditures. Because of differences in scale, SNAP spending is provided separately in Figure 2.

Baseline for Farm Programs in Title I
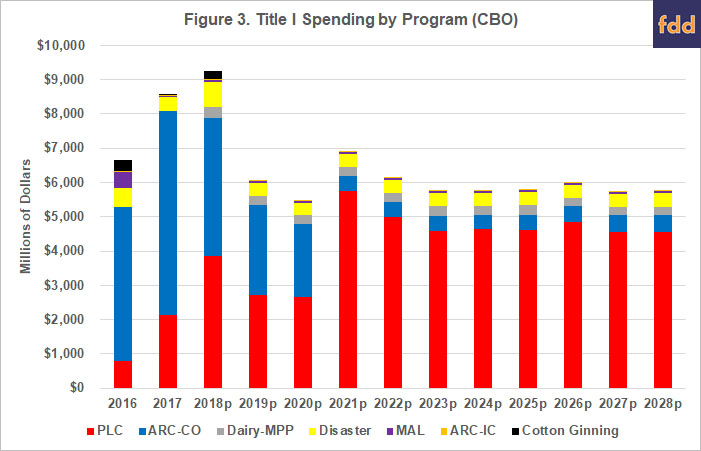
The programs in Title I include the Price Loss Coverage (PLC) and Agriculture Risk Coverage (ARC) payment programs, as well as Marketing Assistance Loans (MAL), Loan Deficiency Payments (LDP), the dairy Margin Protection Program payments (MPP) and disaster assistance payments (both livestock and crop). Figure 3 illustrates the spending for these Title I programs as well as the USDA-created Cotton Ginning Cost Share Assistance Payments. Figure 3 also includes the 2016 through 2018 Fiscal Years to the 10 year projections (2019-2028) to complete the perspective on Title I spending for the 2014 Farm Bill.
It is notable in Figure 3 that spending shifts dramatically from the ARC-CO program to PLC beginning with 2021. This is largely due to two items in the CBO assumptions. First, CBO is projecting relatively lower prices throughout the baseline with wheat, seed cotton and peanuts remaining well below the reference prices in PLC; corn and rice begin below the reference price but move above it in the out year projections, while soybeans remain above the reference price. With so many base acres receiving PLC payments due to prices at or below the reference prices in most years, the PLC program is expected to make substantial payments.
Second, CBO’s projections include participation information as well. The CBO Baseline continues to assume a significant shift by farmers from ARC-CO to PLC, especially for corn. CBO assumes that 84.6% of corn base acres will enroll in PLC beginning in 2019 and 82.1% of wheat base acres will elect PLC. By comparison, CBO assumes that 71.4% of soybean base acres will enroll in ARC-CO. CBO does not provide a participation assumption for cotton under the new seed cotton program but indicates that most payments (over 90%) will be for PLC. Similarly, almost all payments for rice and peanuts are from the PLC program.
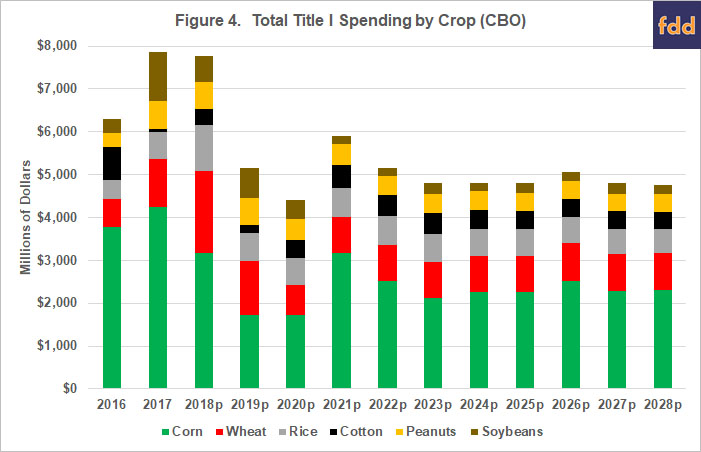
Figure 4 drills down further into spending for each of the major commodities covered by the Title I programs. It illustrates the total fiscal year outlays by major crop (corn, soybeans, wheat, cotton, rice and peanuts) for all programs beginning with Fiscal Year 2016, the first fiscal year that spending for farm programs in the 2014 Farm Bill would be reported given timing shifts for ARC and PLC.
Baseline for Crop Insurance in Title XI
Title XI of the 2014 Farm Bill contained revisions to the Federal Crop Insurance program and CBO includes outlays in the baseline projections. Figure 5 illustrates the spending by the Federal Crop Insurance Corporation (FCIC) for the main items in the program. Outlays consist of three items. Premium subsidies offset part of the costs of crop insurance, reducing the amount of premium paid by farmers. Delivery expenses are costs associated with crop insurance companies and are generally known as Administrative and Operating (A&O) costs. Underwriting is the Federal government’s (FCIC) share of any underwriting gains or excess losses on crop insurance.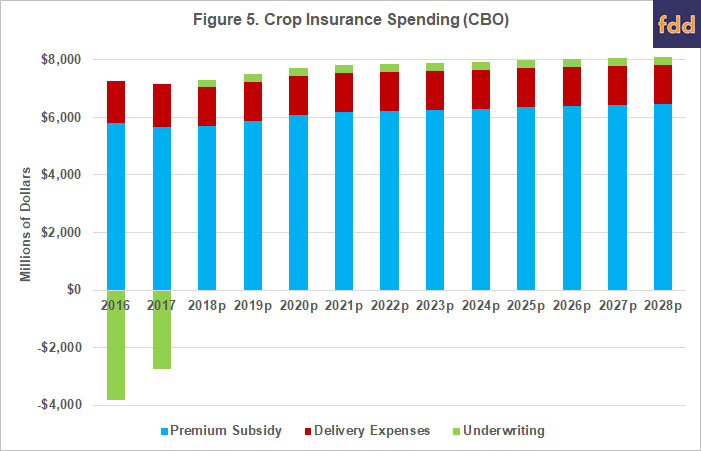
Note that underwriting costs were negative in 2016, and 2017. In these years, total expenditures for premium subsidy and A&O costs exceeded $7 billion each year but indemnities (and losses) were low. The Risk Management Agency (RMA) reported a loss ratio of 0.42 for the 2016 crop year and 0.50 for the 2017 crop year. As such, the FCIC had gains in those years which reduced the Federal costs of the crop insurance program to $3.5 billion and $4.4 billion, respectively. Underwriting represented significant reductions in costs in 2016 and 2017. For projections in the baseline, CBO assumes small underwriting losses.
Baseline for Nutrition Programs in Title IV
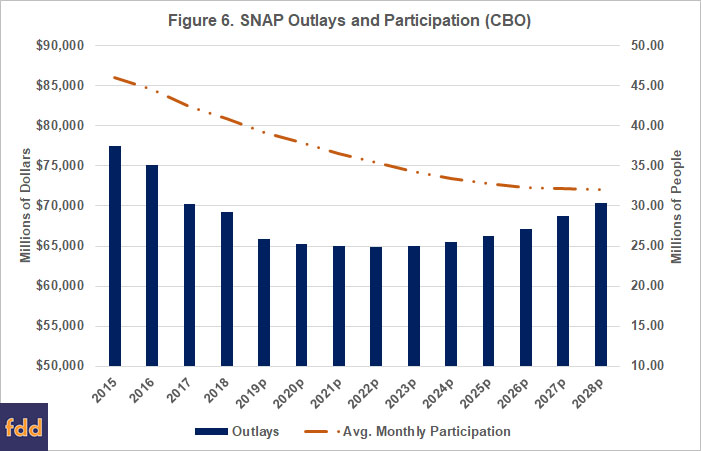
CBO notes that the mandatory outlays in the Baseline projections for the nutrition programs in Title IV are for the Supplemental Nutrition Assistance Program (SNAP), formerly known as food stamps. SNAP represents the largest item of spending in the farm bill (77% of the total), averaging $66 billion per fiscal year in the baseline window (2019-2028). It also serves the largest constituency, with over 39 million average monthly participants in 2019 falling to over 32 million average monthly participants in 2028. On average it provides a low level of benefits, averaging $140 in average monthly benefits per participant in the program during the baseline years.
Figure 6 compares CBO’s reported outlays for SNAP for 2014 Farm Bill fiscal years (2014 to 2018). It also illustrates the CBO Baseline for SNAP through 2028, as well as average monthly participants in the program.
Baseline for Conservation Programs in Title II
Finally, Figure 7 illustrates spending by the major conservation programs in Title II of the Farm Bill. CBO reported expenditures for the 2014 Farm Bill fiscal years (2014-2018) are included for additional perspective on the projections for the baseline fiscal years (2019-2028).
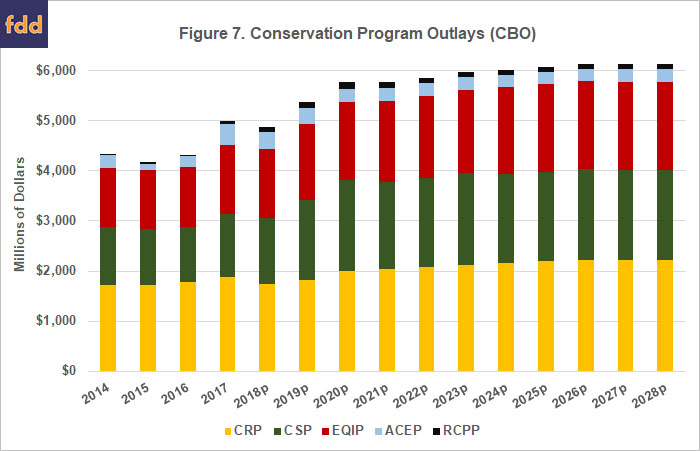
The Conservation Reserve Program (CRP) remains the largest program by outlays and it currently has 24 million acres under its long-term contract. The Conservation Stewardship Program (CSP) spends through five-year contracts with farmers to install, maintain and improve conservation practices across the entire farm. The Environmental Quality Incentives Program (EQIP) is the next largest spending program and it provides individual cost-share assistance contracts for specific conservation practices. The Agriculture Conservation Easement Program (ACEP) uses long-term easements on farmland for the installation, restoration and maintenance of wetlands, the protection of farmlands from development pressures or for maintaining permanent grasslands. The Regional Conservation Partnership Program (RCPP) was created by the 2014 Farm Bill to work across EQIP, CSP and ACEP to coordinate regional-scale conservation efforts in conjunction with non-Federal partners that have to help with costs. It has a far smaller baselines. In total, the baseline for the working lands programs (CSP, EQIP and RCPP) is $35 billion over the ten years, compared to $24 billion for the reserve programs (CRP and ACEP).
Concluding Thoughts
CBO’s April 2018 Baseline will be a major influence on any Congressional effort to reauthorize a farm bill this year. The projected spending in the Baseline represents the funds available to the House and Senate Ag Committees for reauthorization. Under Congressional budget rules, the baseline is a zero-sum game where any changes to policy that are estimated to increase spending must be accompanied by changes that reduce spending. Therefore, this zero-sum game also impacts the politics for writing a farm bill because it can pit interests against each other in a competition for estimated expenditures. For example, changes to farm programs (ARC or PLC) that would increase outlays for one crop would have to be accompanied by changes that reduce outlays for other crops, or those interests would have to go outside Title I and reduce outlays in other programs such as crop insurance, conservation or SNAP. It is generally politically difficult to move funds from one crop to the other. It is far more difficult to move funds from programs in one title to those in another.
One further political complication resulting from the CBO Baseline is an overemphasis on the total outlays. This is particularly the case with the SNAP program, which has the largest total outlays but also provides assistance to the largest number of constituents with the lowest benefit per person. It tends to generate the most partisan, political disputes, however, and these disputes can create serious impediments to successfully reauthorizing a farm bill. Defeat of the House farm bill on the floor in 2013 is the most prominent example and current reports indicate challenges for a farm bill in the House once again because of a focus on reductions in SNAP spending.
The outlook for a farm bill in 2018 depends on many aspects within a time-consuming, difficult political process. Among the most consequential are the CBO spending projections in the April 2018 Baseline. They will influence what interests will be able to achieve within specific programs and titles of the bill, as well as much of the politics surrounding the bill. The information provided in this article illustrates this important background to the farm bill debate; any changes to the programs will be measured against it by CBO, Members of Congress and interested parties.
1 http://farmdocdaily.illinois.edu/2018/04/reviewing-cbo-baseline-for-2018-farm-bill-debate.html