Ukraine has been experiencing strong growth in grain production and exports for a decade. While the Sino-Ukrainian agreements have multiplied since the beginning of the 2010s, it is indeed the European Union which imposes itself as the first importer of Ukrainian cereals. With 11 million tonnes of maize imported into the EU, the year 2018 sets a new record. And with the growing importance of maize with higher yields per hectare than wheat or barley, Ukraine still has room to increase exports.
China and Ukraine have been stepping up diplomatic meetings and partnership agreements since 20111. Ukraine is indeed a strategic issue on the new Chinese silk roads: it is “the first European country” on these new roads2 . The signing of a “Sino-Ukrainian Strategic Partnership Development Plan (2014-2018)” has, in particular, led to significant investment in infrastructure for trade between Ukraine and China. On the grain issue, China signed a loan for grain agreement with Ukraine in 2012. This agreement, which runs for 15 years, provides for a Chinese investment of US $ 1.5 billion, in exchange of which Ukraine has pledged to deliver 5 million tonnes of grain each year, including 2 million tonnes of maize, to the China National Complete Engineering Corporation (State grain enterprise) 3.
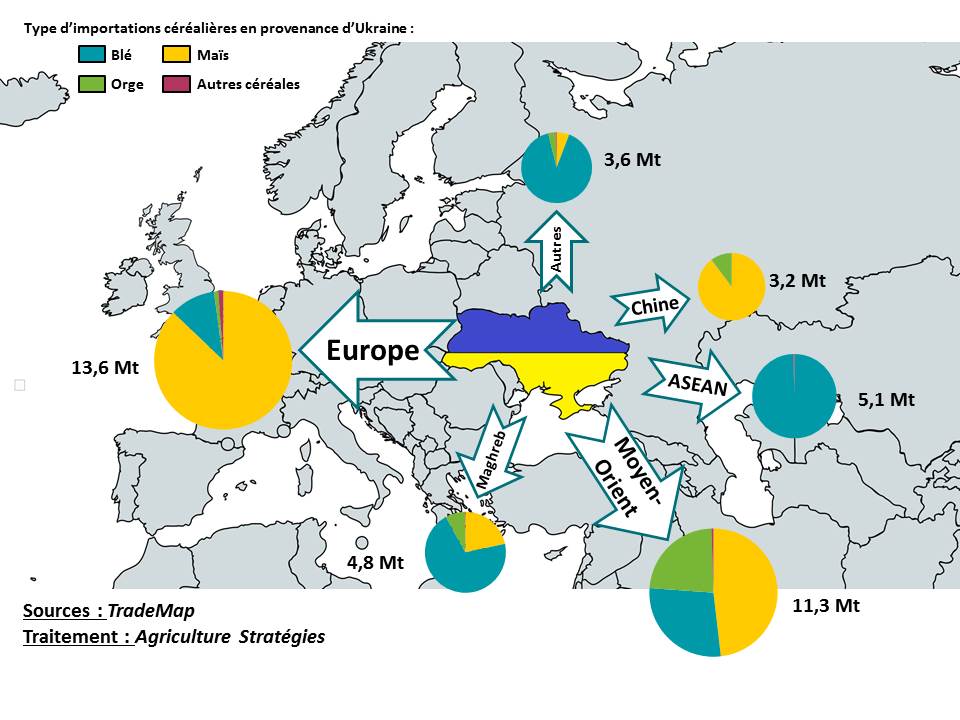
But while Ukraine is firmly established in the new silk routes, the majority of Ukrainian products do not flow through this route. As the map below shows, it is the European Union (EU) that absorbs most of the Ukrainian maize today, with imports rising from 338 000 tonnes 15 years ago to over 11 million tons in 2018.

Figure 1: Main trading partners for grains of Ukraine in 2018
Since 2015 and the signing of the EU-Ukraine Association Agreement, this former Soviet country has a duty-free export quota of 550 000 tonnes of maize4 plus an additional quota of 625 000 tonnes. in 20175. Beyond these import quotas, the EU also grants non-specific quotas, with low or zero duties, for nearly 2.8 million tonnes. But since European tariffs are only triggered for import prices below around € 155 / t, all Ukrainian imports, which account for 30% of total imports, have access to the European market without customs duties. .
A development thanks to the increase of the yields and the optimization of the use of the surfaces
While Russia is more often referred to as the world’s biggest emerging exporter of cereals, Ukraine is not left out. Today the world’s second-largest grain exporter behind the United States (87 Mt), side-by-side with Russia, Ukrainian grain exports have risen from 2.5 to over 40 million tons in 20 years, far ahead of Argentina (7.5 Mt) and Australia (4.9 Mt). As shown in Figure 2, the difference between production and exports is fairly stable at around 30 Mt even though production variations can be substantial.
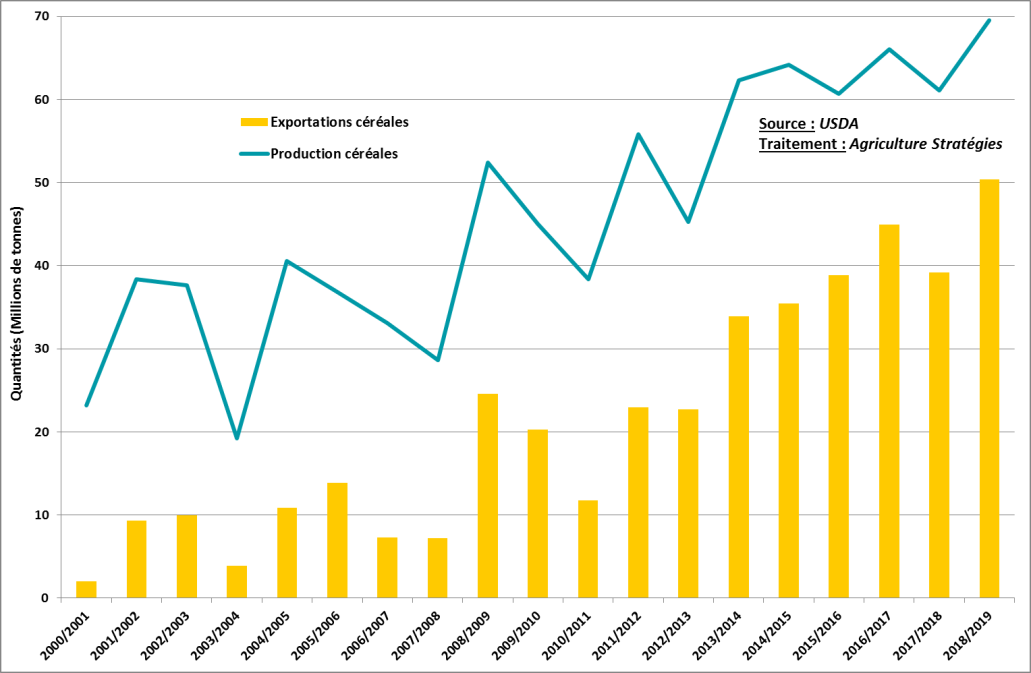
Figure 2: Evolution of cereal production and exports in Ukraine
The low production levels in 2007/08 and 2010/11 led to lower exports and correspond to periods when international prices were among the highest, evidence of Ukraine’s increasing impact on international trade.
The increase in surface area is one of the factors explaining the growth of Ukrainian production. Thanks to technical progress, yields have increased significantly: from 2.53 t / ha in 2006-07 to 4.15 t / ha in 2016-17 in wheat or from 3.73 to 6.60 t / ha for corn over the same period (Figure 3).

Figure 3: Yield trends for maize, wheat and barley in Ukraine
The increase in areas dedicated to cereals is a second explanatory factor. From 2000 to 2018, the area under cereals increased from 11.6 to 14.3 Mha, an average increase of 1.2% per year.
Finally, as shown in Figure 4, the third explanatory factor is credited to changes in the distribution of areas between cereal crops. The portion dedicated to maize (in yellow) has in fact increased from 15% to 30% of the total cereal area, ie an average annual increase of 1.5%. This “cornification” has mainly been done to the detriment of barley (in purple).
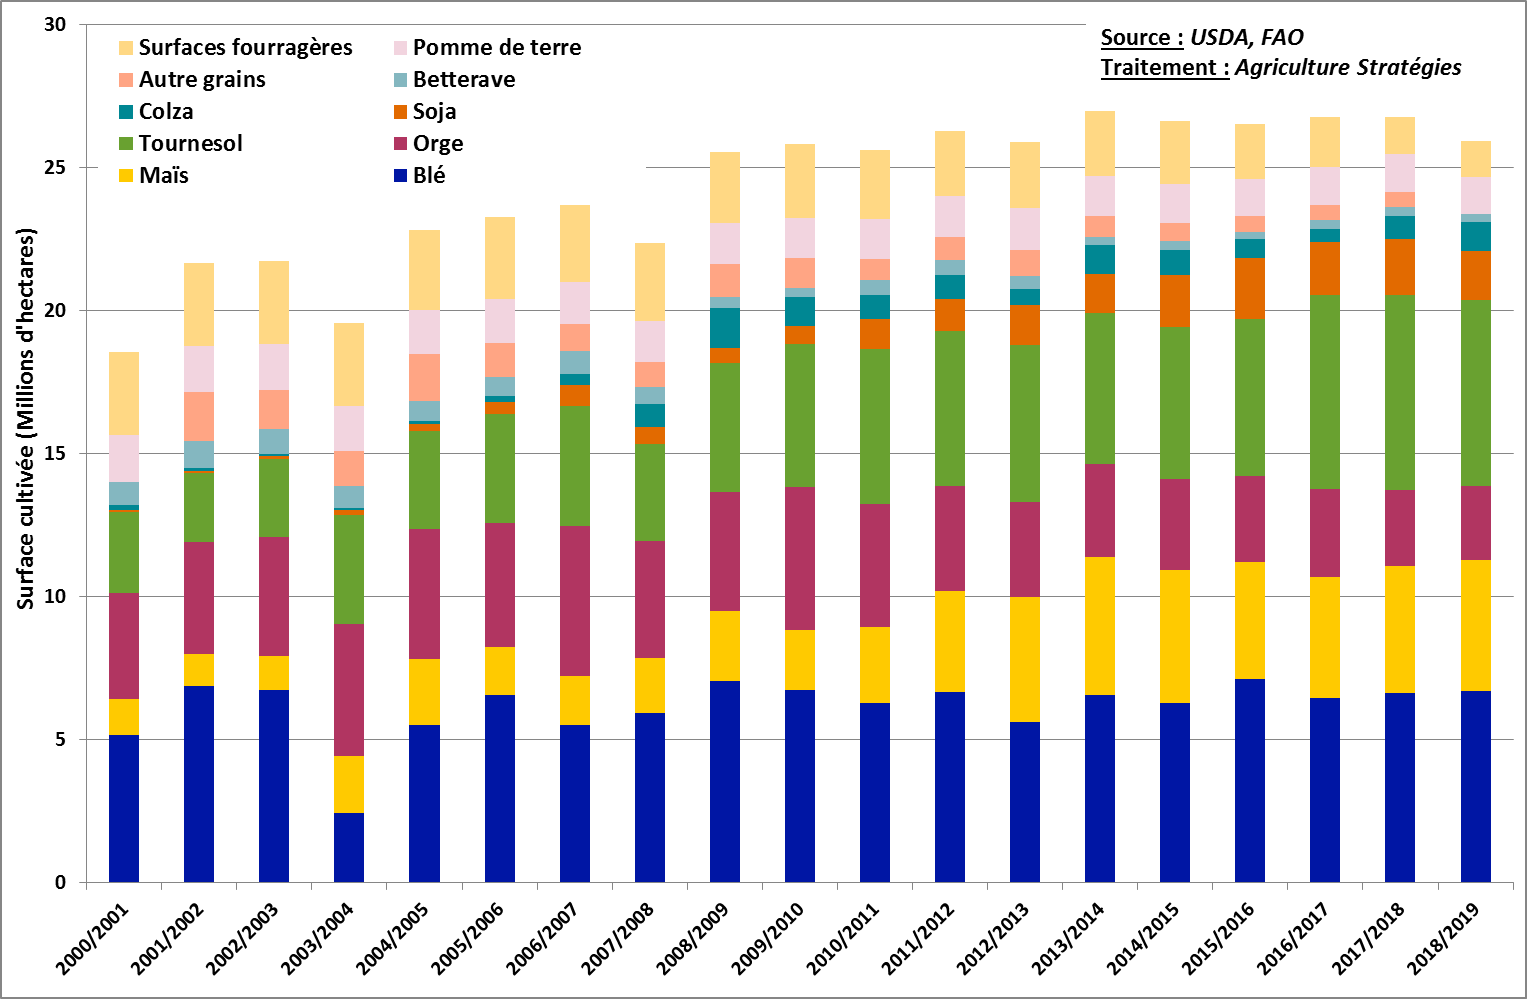
Figure 4: Evolution of Ukrainian Crop
This phenomenon reflects Ukrainian agriculture in search of higher productivity and has the budgetary means and access to more productive seeds.
Towards more exports to the EU?
What relative weights have each of the three factors (yield, total area and conversion to maize) in the increase in Ukrainian grain production? At constant yield, the effect of the sole increase in total area induces a 5% increase in Ukrainian cereal production. Still at constant yield, the conversion of acreage to corn is up by almost 27%. It is therefore the increase in yields that is the main explanatory factor: between 2008 and 2018, 68% of the increase in production is attributable to the best yields.
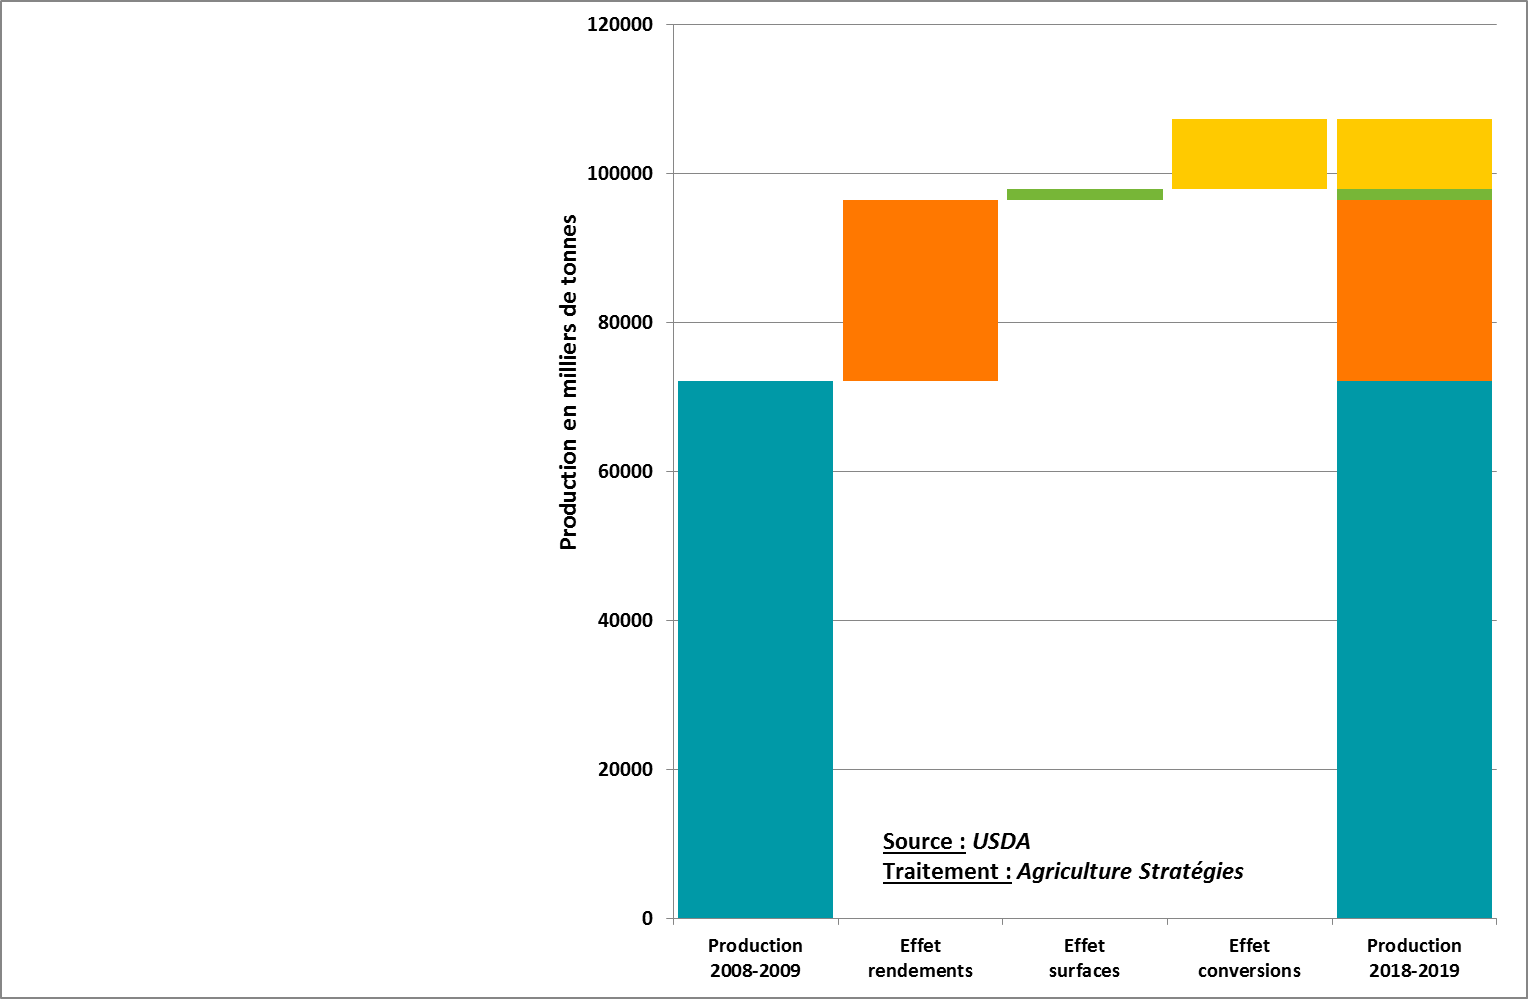
Figure 5: Comparative impact of the three factors for increasing cereal production in Ukraine
Beyond this retrospective analysis, the development potential of Ukrainian cereals still seems important. Corn planting may lead to decreases in barley area. And especially with regard to maize yields in the EU (7.3 t / ha over the last five years) and in the USA (10.9 t / ha), the Ukraine farm still has significant margins. While China could be expected to absorb this growth in supply on the Black Sea, it is ultimately the EU that is emerging as the first outlet for Ukrainian cereals.
Christopher Gaudoin, Strategic analyst for Agriculture Strategies
1 https://china.mfa.gov.ua/en/ukraine-cn/diplomacy
2 http://euromaidanpress.com/2016/12/07/ukraine-china-international-relations-silk-road-trade/
3 https://af.reuters.com/article/commoditiesNews/idAFL8N1XH2JJ
4 https://eur-lex.europa.eu/legal-content/FR/TXT/PDF/?uri=CELEX:22014A0529(01)&from=FR
5 https://eur-lex.europa.eu/legal-content/FR/TXT/PDF/?uri=OJ:L:2017:254:FULL&from=PL