The end of the quota system pushed the European sugar sector into crisis. By releasing the European production potential, it has led to the European market being connected to international prices which are currently at their lowest. While Brazil, the world’s largest exporter, holds a major leadership role, the end of European quotas in 2017 as well as the important reform of 2006 show that European decisions are not without effect on international (im-)balances.
This study traces the main stages of the European sugar policy since the 1968 regulation which established the European quota system. It also provides an overview of sugar policies in the main producing countries (Brazil, India, Thailand, China, USA, Russia) which shows in particular that the European Union (EU) and Brazil are the only two major producers directly connected to international exchanges. Finally, based on an analysis of the fundamentals of production, consumption and trade on a global scale, we seek to lay the foundations for a new European sugar policy that seeks to meet the regulatory needs of the European sector while becoming a stabilizing factor at the international level.
1. The European sugar sector, a development in the protective framework of quotas since 1968
In 2018, the European Union was the world’s third-largest sugar producer, producing 19.5 million tonnes, or about 10.2% of world production. Sugar is mainly derived from sugar beet, and comes largely from northern Europe (Figure 1). France in particular stands out with almost 33% of European production in 2018, followed by Germany (22%) and Poland (12%)[1]. The sector is concentrated with seven companies, mostly cooperatives, which produce almost 85% of European sugar[2]. And in total, 15 groups process 98% of EU sugar in 106 industrial sites.
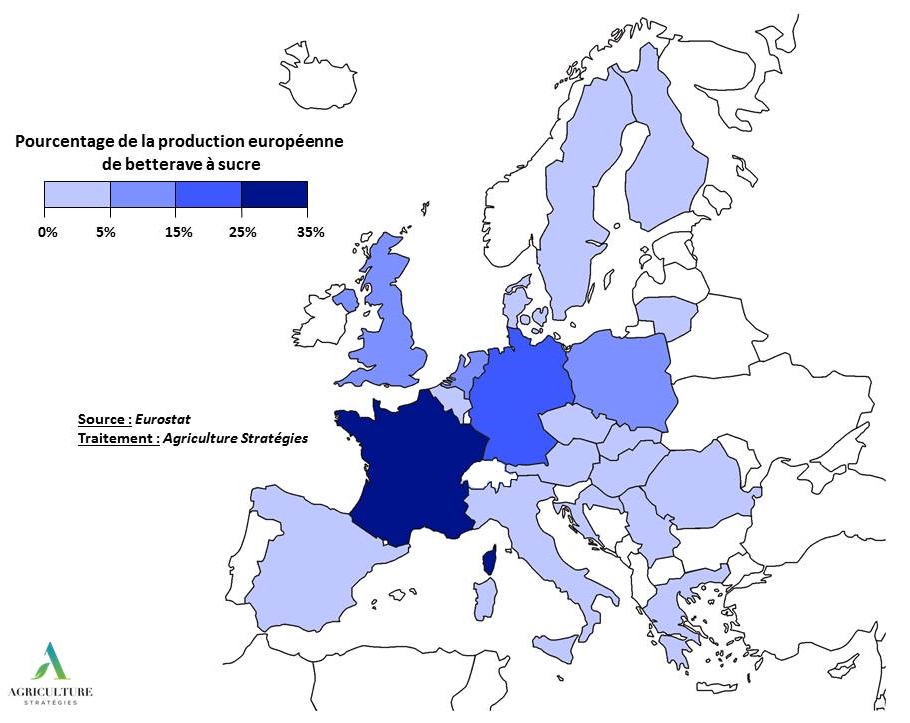
Figure 1 : Main sugar beet producing countries in Europe
From 1968, one of the most interventionist common market organizations
The sugar industry was the first to experience a production quota in Europe, well ahead of the milk quotas of the early 1980s. Sugar and quota beet benefited from high minimum prices. Quota volumes were defined to cover European needs while providing a margin of safety. If there were no climatic incidents affecting yields, part of the surplus stocks benefited from export subsidies which were partly financed by the planters and the industrialists themselves through a contribution levied on part of the quota.
Moreover, quotas did not constitute a ceiling for production, it was possible to produce more, but the excess part of production had to be exported: it did not benefit from higher Community prices but was valued at the level of international prices. We generally speak of “double quota” to qualify this type of regime where the volume under quota is better valued but that production out of quota remains possible.
The common organization of the sugar market has led to a substantial increase in production on the European continent (Figure 2). Beet growing guaranteed a stable and higher turnover than other crops. In addition, technological advances in production and processing have led to a significant improvement in productivity.
The sugar factories thus underwent a very important phase of modernization and concentration during the period. They were also the object of a major integration movement: they were gradually bought back by the producers themselves who set up cooperatives. In France, for example, if producer cooperatives held only 15% of processing capacity in the 1980s, this share now exceeds 95% (including a German cooperative).
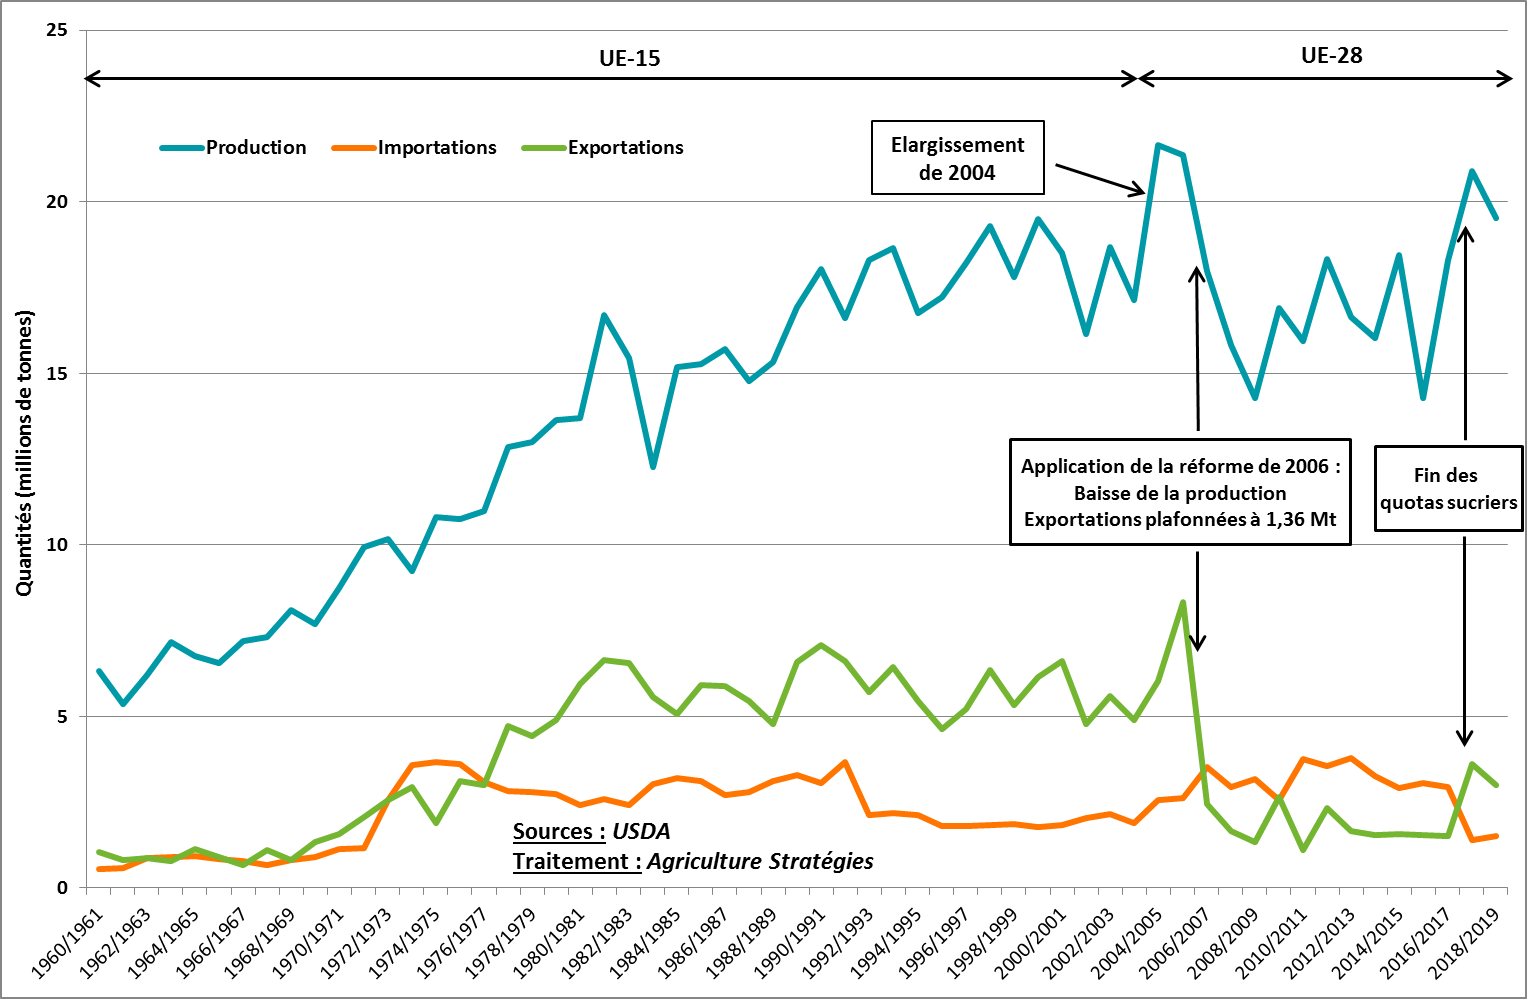
Figure 2 : Production, importation and exportation of sugar in Europe
Focused on the European market, the quota system did not close off the European Union. Exports stabilized at the beginning of the 1980s at around 5 Mt. On the import side, variable levies at European customs allowed the minimum price to be maintained. But they had to be replaced by fixed duties from 1995/96 in application of the Marrakesh agreements. While there was talk of reducing them in the context of the Doha Round negotiations, customs duties on entry into Europe still remain high today: 419 €/t for white sugar and 323 €/t for brown sugar (unrefined).
Import flows on European territory therefore result from preferential trade agreements for which rights are low or zero. Following enlargements of the EU and agreements with 15 ACP countries (Africa, Caribbean and Pacific), in the framework of the Lomé Convention signed in 1975, various countries were able to benefit from access to the European market that was very attractive as the community prices were high.
This trade preference regime underwent a major shift in the early 2000s. While a share of imports (around 1.1 Mt) continued to be governed by low or zero duty quotas, this is not the case either for flows from least developed countries (LDCs) since the Everything But Arms (EBA) initiative in 2001, or for ACP countries with the implementation of the Economic Partnership Agreements (EPAs) following the Cotonou agreement: these countries have unlimited access to the European market. More specifically, access granted to LDCs was part of a transitional period running until 2009. The prospect of seeing imports entering the EU with no control, combined with Brazil’s attack on the quota system with the WTO, led to the 2006 reform.
2. The 2006 reform, a major reform for the European sugar sector
The European sugar industry remained relatively unchanged from the 1992 CAP reform movement, which led to lower guaranteed prices for cereals and beef and the introduction of direct aids per hectare and per head of cattle. But with the end of the “peace clause” signed in Marrakesh, Brazil struck the charge against the European sugar policy by seizing the WTO in 2003. The world’s largest sugar exporter accused the EU of not counting re-exports of ACP sugar in its export subsidy limitation commitments. In addition, it challenged the double quota system as a form of export subsidy for over-quota production.
This standoff has led the European Union to meet its commitments made at the time of the creation of the WTO: subsidized exports should not exceed 1.35 Mt even though the volumes actually marketed were more than 5 Mt and that unlimited access to the Community market had been given to LDCs.
The 2006 reform represents a complete change of logic in the regulation of the European sugar sector. Under the 1968 regime, exports were the adjustment variable to stabilize the domestic market and the volume of imports was under control. The aim of the reform will be to cap exports and adjust European production, taking into account almost unimpeded import flows.
To adjust the internal market quotas are maintained but reduced by more than 6Mt in 3 years. The restructuring is done on a voluntary and incentive basis: it is proposed to buy back the quotas and compensate the plant shutdowns. The restructuring fund is directly fueled by a tax on sugar. The aim is also to concentrate production in the most productive areas, but countries that have chosen to abandon more than 50% of their production will be able to benefit from aid coupled with hectare of beet to maintain a few processing plants.
To limit the risk of import flows from LDCs and ACP countries, the European minimum sugar price is lowered by 36% to 404.4 €/t. In compensation, producers receive aid covering 60% of the price drop. This aid is decoupled – it is also paid to producers who have stopped beet production – and is directly integrated into the single payment entitlements (SFPs) which were then being introduced. Beet growers will have stronger SFPs, but the gap will narrow as the SFP’s face value converges as a result of subsequent reforms.
A fine mechanism of management of the internal market …
The quota level was set according to European food needs. Out-of-quota production was allowed, but the sugar factories had to prove that they had sufficient outlets. Non-quota production covered sugar exports but also alcohol and ethanol production. It was during this period that the biofuel sector experienced a significant growth, encouraged by increasing incorporation mandates in fuels.
Out-of-quota production also provided significant latitude. In the event of tension on the European sugar market, a share of non-quota production could be requalified in quota production. This provision was used in particular in 2011. Conversely, the Commission had the option of adjusting the quota volume downwards in order to maintain the market equilibrium, including in the case of excessively large imports.
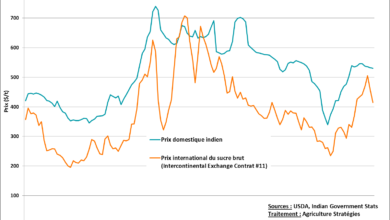
The 2006 reform had the desired effects: the EU became a net importer of sugar and the international price had a favorable evolution until reaching European prices in 2010 (Figure 3).
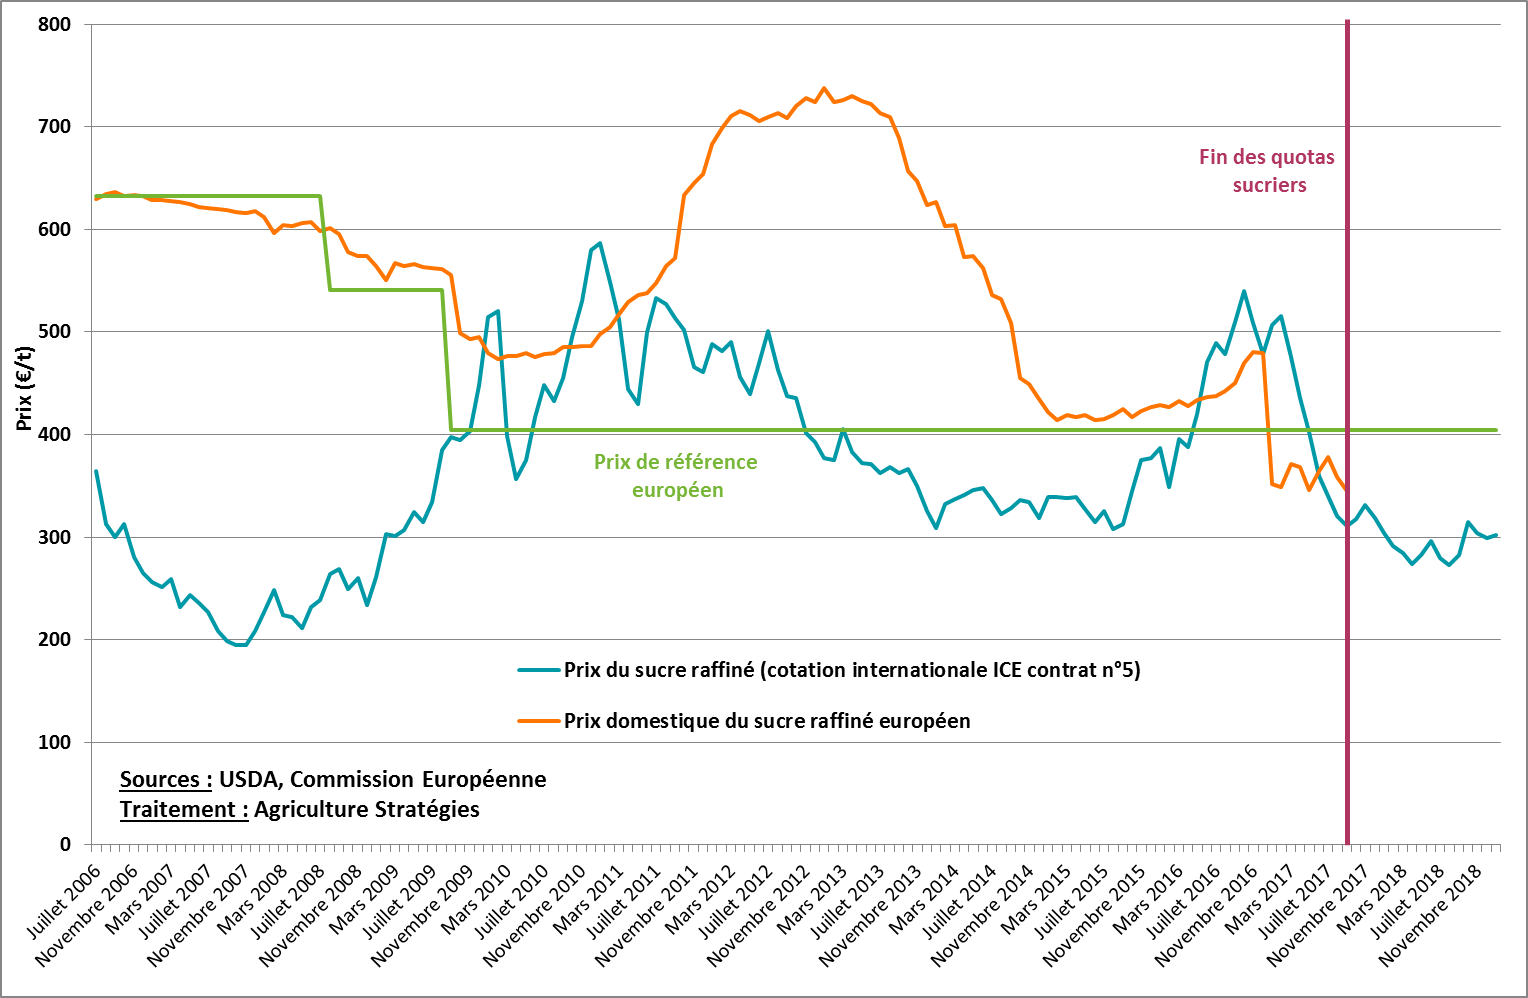
Figure 3 : Evolution of european and international prices since the 2006 reform
… that led to a slip
Paradoxically the convergence between the international price and the European price caused an escalation on the European side from 2011. With European prices close to international prices, exports were no longer constrained by WTO rules. In addition, low duty import quotas (98 €/t) were no longer fully used. Finally, third explanatory parameter, the level of European stocks was low, which is a constant, including for cereals, so much so that one can speak of a European distrust vis-à-vis storage (the ratios of inventories are consistently lower in Europe than in other major producing countries). As a result, the tensions observed on the international markets in 2010 and 2011 resulted in a rise in the Community price to over 700 €/t, well above the minimum price of 631.9 €/t in effect before the 2006 reform.
These tensions on the Community market called for emergency measures for the 2012/13 campaign: an additional import quota of 0.4 Mt was recorded as well as the export restriction of 0.65 Mt. However, what is especially important from this episode is that the fixed tariffs can cause abrupt lurches when the country becomes a net importer: the variable levies remedy this type of inconvenience.
3. Abandoning sugar quotas: produce more to earn less
Difficulties in dealing with this episode of tension passed relatively unnoticed. Involved as early as 2011, ahead of the 2013 CAP reform, the Commission prepared the spirits for a removal of hardly reformed quotas. The main argument was that sugar had to undergo the same evolution as the other productions, the abandonment of milk quotas having been decided in 2008. In addition, the era was euphoric for almost all productions, the “9 billion mouths to feed in 2050 speech” was in full swing: the food supply was not going to be able to follow a growing demand, the problem of shortages would definitely replace that of overproduction.
The end of the sugar quotas was recorded during the CAP reform of June 2013. During the negotiation, the initial deadline of 2015 was postponed by 2 years. The economic players wanted to be offensive and hoped to conquer export market shares: they would no longer be constrained by the export quota. The direct connection to international trade was not considered a problem: it was already the case for cereals where the futures markets were hedging, moreover the deregulation was to generate greater volatility and therefore more opportunities for those who would make the right coverage choices. Finally, the Commission introduced in the CAP the possibility of financing income and economic mutual funds (Income Stabilization Tool). In short, private risk management tools could replace a quota system that limited export ambitions.
But, unlike the 2006 reform that had helped to increase international prices, the end of quotas made the EU a net exporter and contributed to imbalances in a market where stocks had recovered. While Brazil has a leading role in international trade, it cannot be said that changes in European sugar policy have no impact on world prices, especially when the 2006 reform aimed specifically at removing dumping that the Brazilians blamed for the 1968 scheme.
Two years after the end of sugar quotas the sector is in crisis
The profitability of beet production is at an all-time low, the promised private risk management tools are not there and tensions are increasing within the sector and among certain actors. On the side of the European sectoral regulator, the European Commission, there were no other reactions than the creation of a working group despite various requests from Member States. In September 2017, however, the Commission stated that it was “convinced that, after one or two marketing years, beet and sugar producers will have fully adapted to the new market environment. […] The Commission will remain attentive to these possible evolutions and will not hesitate to make use of the safety net measures available to support producers “.
As for other productions, the dismantling of CAP regulation tools will not only have made losers: the competitiveness of the agri-food industry has been improved, the European food industry can now provide the lowest price. It will have been necessary to wait until the end of 2017 to know the big winner of the reform of the CAP of 2013: it is Coca-Cola which with purchases of 1 Mt of sugar on the European territory can now buy at 300 €/t against 700 €/t in 2013, a profit of 400 million euros per year!
Factory closures are announced, suggesting a drop in European production. Becoming a net importer is certainly the way to no longer contribute to global overproduction and hope for an increase – at least temporarily – in international prices. But is it a sustainable prospect for a heavy industry marked by high fixed costs where factories can hardly run low without increasing unit production costs? On the contrary, it seems essential to rethink a European sugar policy. To do this, in addition to the teaching that the end of quotas did not result from external pressures but from unfounded European decisions, putting into perspective the sugar policies of other major producing countries and the analysis of the fundamentals of the sugar market appear to be prerequisites.
4. Brazil and the European Union: the only two major producing countries “at international prices”
The review of sugar policies led us to produce six synthetic monographs in which the main instruments at work and their evolutions are analyzed. This work has been conducted for Brazil, India, Thailand, China, the United States and Russia. The table below (Figure 4) provides a synthetic reading of all these monographs.
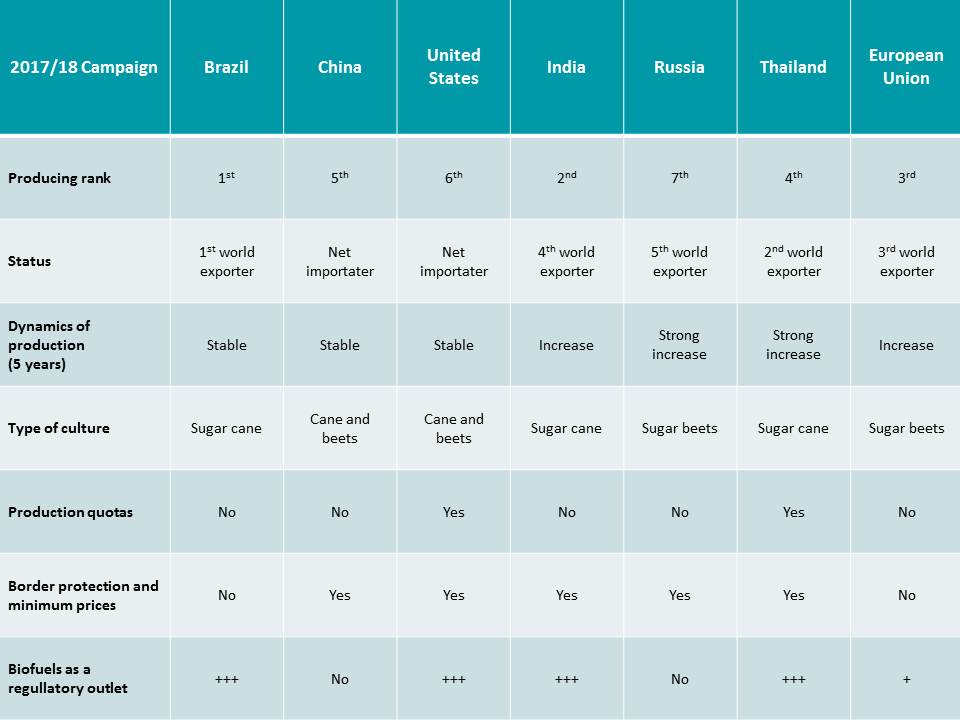 Figure 4 : Summary of sugar policies in the world
It appears that the sugar policies of the main producing countries are still interventionist. Even in Brazil, which has no quotas, no minimum price, and no border protection, the incorporation of ethanol into fuels is a lever for regulating the sugar market. Brazil may be the world’s largest sugar exporter, but there are more rods for ethanol production than sugar, and the rate of incorporation is, to some extent, adjustable. Thailand, the USA, India and the EU are also using this alternative outlet for sugar.
Although suppressed in the EU, production quotas still exist in the United States and Thailand. The American quotas are strict and do not allow production out of quota, while in Thailand it is a double system. The latter is also being reformed following recent attacks, similar to those that the EU experienced with respect to the 1968 regime.
Apart from Brazil, all countries have customs import protection. Russia has a variable exchange rate system that offers legibility to economic actors: rates depend on the level of entry prices and are known in advance.
The combination of country-specific instruments is directly reflected in domestic prices. The graph below (Figure 5) shows the average price of white sugar in 2018 for the 7 major producing countries. The height of each stick is proportional to the price and the width to the quantity produced. The European average is slightly higher than the Brazilian average because as shown in Figure 5 below, the two prices did not meet until the year 2018.
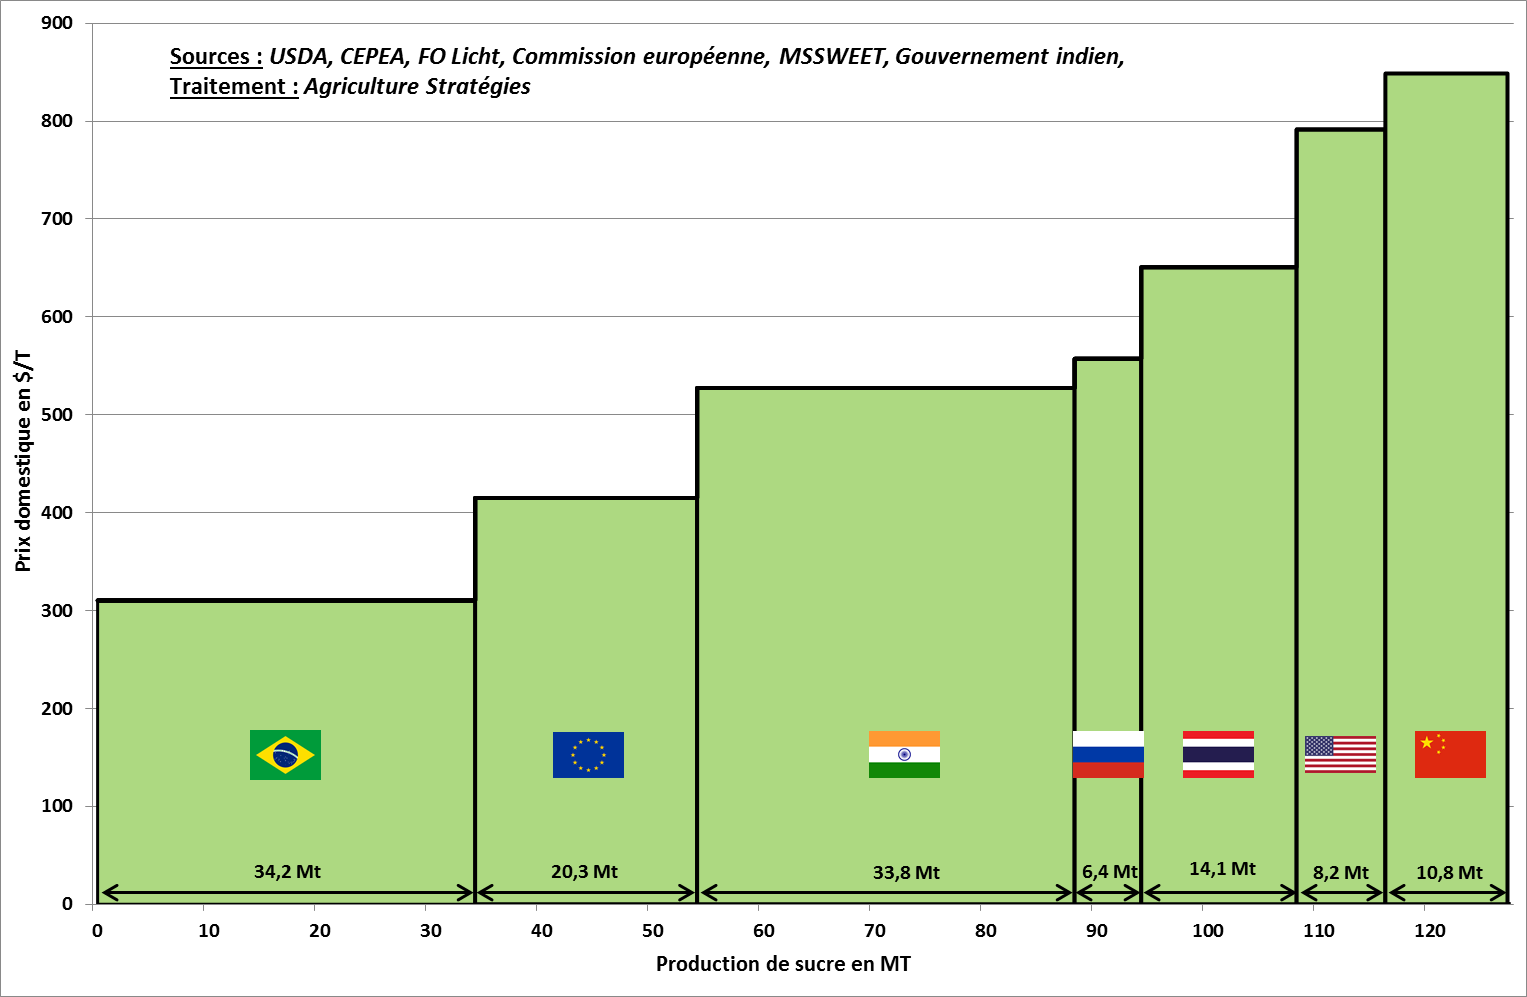
Figure 5 : Prices of refined sugar and quantities produced by the main world producers in 2018
The main conclusion in the graph above is that there is no “world sugar price”. The international sugar price corresponds to Brazilian exports and the EU is the only major producer country to be directly connected to this price with the end of sugar quotas. The international price is not an equilibrium price, but the price of the most productive producing country, which no other country can afford without protection. It is therefore not an equilibrium price, which in theory stands at the intersection of aggregate supply and aggregate demand and which must correspond to the cost of production of the less competitive producers but nevertheless necessary to satisfy the demand.
5. Fundamental analysis shows the structural instability of the sugar market
Figure 6 shows world production, consumption and stocks of sugar based on FO Licht reference data. Since 2000, production and consumption have evolved similarly from 130 Mt to 190 Mt. Over the 19 years, only 5 have seen consumption exceed production, this is particularly the case of the 2008 and 2009, application of the reduction of European production. The stocks (green batonets) show astonishing stability: over the period they are in a narrow range between 60 Mt and 80 Mt.
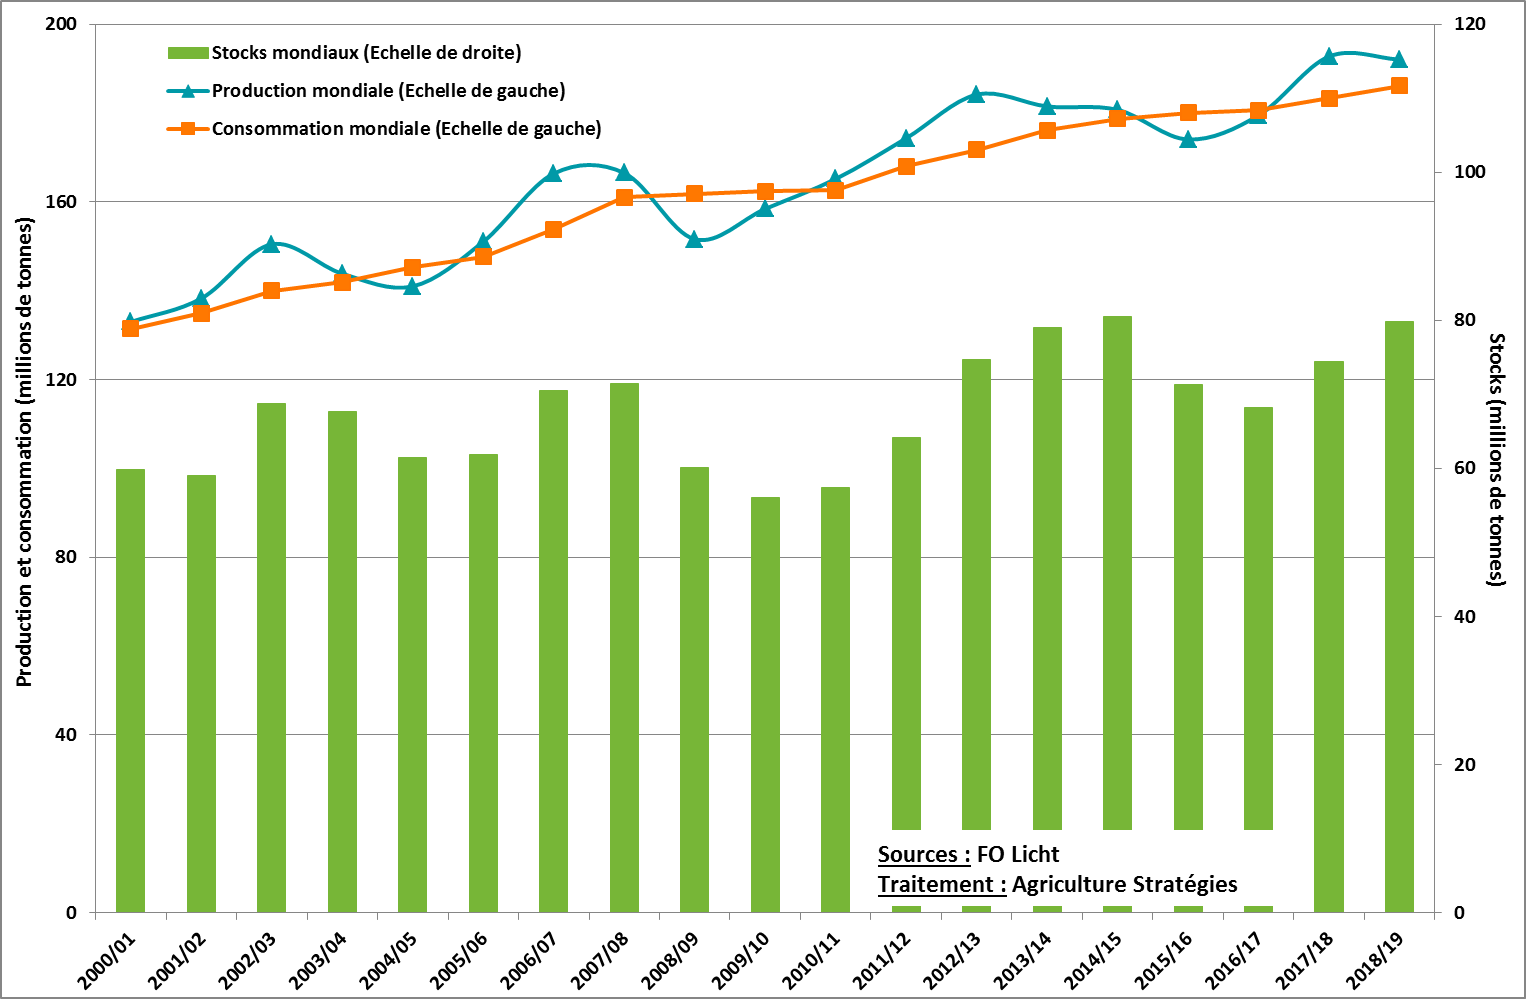
Figure 6 : Production, consumption and world stocks
To analyze the formation of prices and the sensitivity of a market to the equilibrium between supply and demand, it is customary to put the evolution of prices in terms of the stock-to-consumption ratio (Figure 7). Since 2000, this ratio has ranged between 35% and 50%, while the annual average prices, representative of international trade, ie Brazilian export prices, have varied between 200 and 500€.

Figure 7 : Evolution of prices and stock to use ratios
Thus, everything happens as if with a stock level corresponding to 127 days, or nearly 4 months, the market considered that it was close to the shortage and that it was necessary to send a message of scarcity, via a rise of price, to encourage producers to produce more. Conversely, with the equivalent of 6 months of consumption, the market is depressed and prices are at their lowest.
The difference between these extremes is only 2 months of consumption, or about 32 Mt of sugar. So if we take the pivot value of 5 months of consumption as an adequate stock level, it appears that with a stabilizer wheel of 16 Mt, we would be able to rebalance the fundamentals of the international market regardless of the shocks on the supply or on request. Given the natural outlet for sugar, ethanol, which already serves as adjustment variables for major exporters, it is quite tempting to convert the 16 Mt sugar wheel into ethanol and bring it back to annual world consumption. of oil. With one tonne of sugar per 1250 liters of ethanol and an annual consumption of 100 million barrels per day, it is established that the stabilizing flywheel of 16 million tonnes corresponds to 0.34% of the annual consumption of oil.
This figure highlights the importance of greater flexibility in biofuel policies and their coordination at the international level. The Brazilian example, long engaged in this process, has already been widely copied by most of the major producers. At a time when the WTO’s agricultural rules are being challenged and we are looking for a new multilateral framework for food security and the fight against climate change, the coordination of more flexible biofuel policies should be seen as the means to favor food uses while having stabilizer for international markets and pursuing the development of renewable energy.
By way of conclusion: the urgency of a new European sugar policy
The abolition of the reformed quota system in 2006 was a consequential error of collective euphoria and ideological orientation, where faith in the proper functioning of markets has laid the foundations for the justification of public intervention on the markets agricultural markets, foundations more than ever respected in other major producing countries. If we can expect a rise in prices in the next few years of the decline in European production or Thai exports whose sugar policy is being reformed, the future of the European industry is compromised if a new sugar policy is not started in the short term. Collective thinking must be initiated because the European Union cannot turn its back on its responsibilities with regard to the security of its sugar supplies, the stabilization of international trade and the development of renewable energies to prepare the post-oil era.
[1] Données Eurostat
[2] Rapport CGB 2018. http://www.cgb-france.fr/wp-content/uploads/2019/01/ra2018-livre-bd-v2-1.pdf